Under rare circumstances, the CBOE Volatility Index has a 100% success rate forecasting directional moves in the S&P 500.
Although stocks have been the top-performing asset class over the last century, based on average annual return, this doesn’t mean the stock market moves from Point A to B in a straight line — and the last seven weeks is evidence to this fact.
Since the S&P 500 (^GSPC 1.81%) reached its all-time closing high on Feb. 19, the ageless Dow Jones Industrial Average (^DJI 1.56%), benchmark S&P 500, and growth-centric Nasdaq Composite (^IXIC 2.06%) have plunged by 15.6%, 18.9%, and 23.9%, respectively, through April 8. Both the Dow and S&P 500 are firmly in correction territory, with the Nasdaq mired in its first bear market since 2022.
When emotions rule the roost on Wall Street, investors often look to historical events and correlative data points for clues as to where the bottom might be, or which direction stocks will head next. Though there isn’t a one-size-fits-all indicator that can predict the future with any concrete guarantee, there are a very small number of metrics and events that have strongly correlated with directional moves (higher or lower) in the Dow Jones, S&P 500, and Nasdaq Composite throughout history.
Last week’s closing value for Wall Street’s CBOE S&P 500 Volatility Index (^VIX -7.76%) (commonly known as the “VIX”) provided one such example of a data point that’s forecast the future with 100% accuracy over the last 35 years.
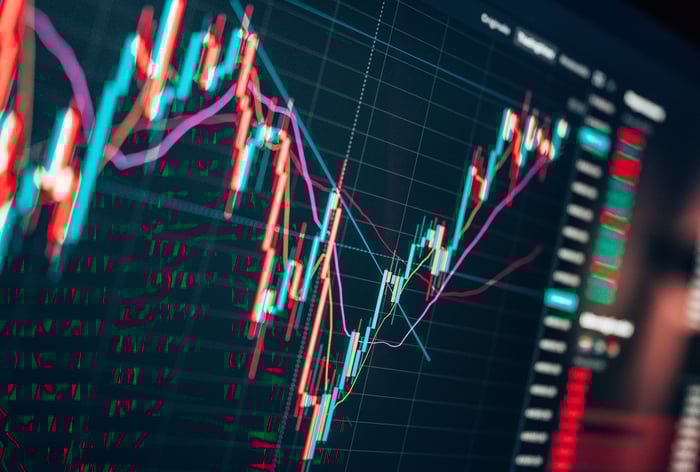
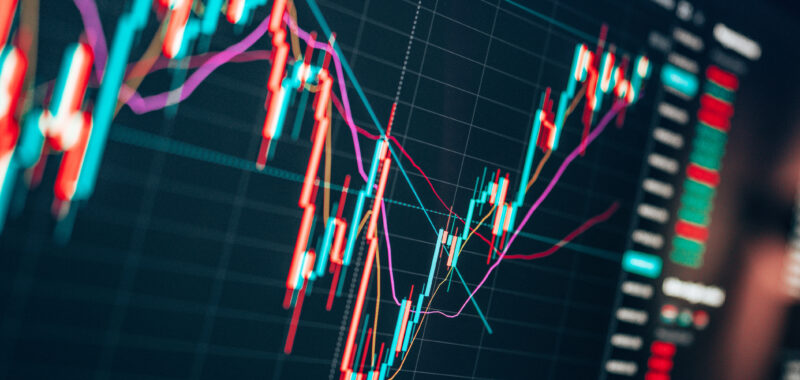
Image source: Getty Images.
Two reasons the stock market has crashed
It’s one thing for the stock market to correct lower or enter a bear market in an orderly fashion. This is more or less what investors witnessed with stocks declining during the fourth quarter of 2018 and through the first nine months of 2022. But it’s an entirely different scenario when the proverbial elevator is used to move stocks lower.
Between April 3 and April 4, the broad-based S&P 500 lost 10.5% of its value. Meanwhile, the Dow Jones Industrial Average has lost in excess of 10% (4,580 points) spanning just four trading sessions (April 3 through April 8). What we’re witnessing in the stock market is very much the definition of a crash, and it’s been precipitated by two factors.
For starters, there’s clear concern about President Donald Trump’s sweeping tariff policy, which he labeled as “Liberation Day” for America. On April 2, the president unveiled a global 10% tariff, along with a host of higher “reciprocal tariffs” on select countries that continually run adverse trade imbalances with the U.S.
Instituting tariffs, which are an added tax on imported or exported goods, runs the risk of inciting a trade war with China and/or worsening trade relations with America’s allies. The lack of differentiation between input and output tariffs also risks reigniting inflation and slowing or reversing economic growth. An April 3rd update from the Federal Reserve Bank of Atlanta’s GDPNow model is calling for U.S. gross domestic product (GDP) to contract by 2.8% in the first quarter.
The other issue that’s facilitating a stock market crash is the historical priciness of equities.

S&P 500 Shiller CAPE Ratio data by YCharts.
In December 2024, the S&P 500’s Shiller price-to-earnings (P/E) Ratio, which you’ll also find referred to as the cyclically adjusted P/E Ratio (CAPE Ratio), hit a closing peak of 38.89 during the current bull market. This reading is more than double the average Shiller P/E multiple of 17.23, when back-tested to January 1871.
In the 154-year back-tested history of the Shiller P/E, there have only been six periods where it’s spent at least two months above a reading of 30, including the present. Though the Shiller P/E isn’t particularly useful in helping investors decipher when stocks will move lower, a reading of more than 30 has been a precursor for a sizable decline of 20% (or greater) in the Dow, S&P 500, and/or Nasdaq Composite every time.
Even with the stock market crashing, the S&P 500’s Shiller P/E closed at a multiple of 30.74 on April 8. This is still historically pricey and indicative of additional downside to come in the short-term.
Image source: Getty Images.
Wall Street’s VIX has a flawless track record of forecasting directional moves in the S&P 500
With a better understanding of what’s driven the stock market into its recent spiral, the following discussion about the CBOE Volatility Index is going to make a lot more sense.
The VIX is a tool created by the Chicago Board of Options Exchange (CBOE) that measures the stock market’s expectation of volatility, based on the price of S&P 500 index options, over the next 30 days.
Generally, if the VIX has a low reading of 10 to perhaps as high as 20, it signals that investors expect minimal volatility over the coming month. In comparison, when the VIX surpasses 30, it often signals a rising level of investor fear and uncertainty in equities, which can lead to wild swings.
Following the two-day crash in the S&P 500 that saw the index lose 10.5% of its value, the CBOE S&P 500 Volatility Index closed at 45.3 on April 4. For what it’s worth, it’s moved even higher, as of this writing on April 8, to a reading north of 52.
Based on data aggregated by Creative Planning’s Chief Market Strategist Charlie Bilello, last week’s close was the 21st time since 1990 that the VIX ended a week at more than 45.
The $VIX ended the week at 45.3, among the highest weekly closes in history.
What has happened in the past following the highest $VIX levels?
Stocks rallied 100% of the time over the next 1, 2, 3, 4, 5 years with returns far above historical averages.https://t.co/l5IYmkeySJ pic.twitter.com/dLB7ekFPJA
— Charlie Bilello (@charliebilello) April 5, 2025
But here’s where things get interesting…
Bilello mapped out the one-, two-, three-, four-, and five-year total returns (including dividends) of the benchmark S&P 500 following the previous 20 instances where the VIX ended a week at 45 or higher. Among these 100 total return data points, the S&P 500 was higher 100 out of 100 times!
Something else worth pointing out is that the S&P 500 didn’t just eke small gains after these historically high readings in the VIX. Average total returns across these prior 20 occurrences clocked in at:
- 39% one year later.
- 60% two years later.
- 63% three years later.
- 95% four years later.
- 139% five years later.
Every figure above doubles or triples the average annual total return during all the other periods where the VIX wasn’t at heightened levels since 1990.
Although nothing on Wall Street is guaranteed, 100 out of 100 is compelling evidence to suggest that buying high-quality stocks during periods of panic and heightened volatility is a genius way to generate long-term wealth.