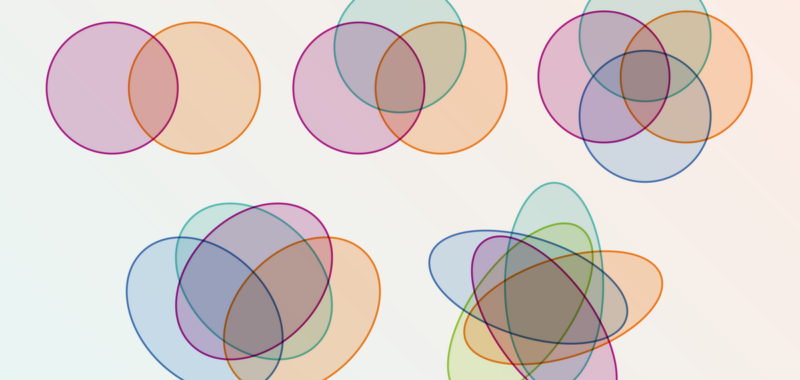
In his book The Mathematical Universe, mathematician William Dunham wrote of John Venn’s namesake legacy, the Venn diagram, “No one in the long history of mathematics ever became better known for less.” While Venn diagrams may not have solved any long-standing open problems, surely these interlocking rings deserve more credit. Their compact representation of group relationships explains their enduring appeal in classrooms, infographics and Internet memes.
Not merely visual aids, Venn diagrams can help us solve everyday logic problems, and they give rise to surprising geometric questions. Have you ever seen a proper Venn diagram with four overlapping circles? No, because it’s impossible. Venn himself discovered this and came up with a clever fix, but this only begot deeper geometric puzzles that mathematicians still study today.
Venn debuted his diagrams in 1880 as a method for visualizing contemporary advances in logic. They then found application in the closely related branch of math called set theory, which focuses on collections of objects. Venn diagrams typically consist of overlapping circles, with each representing some set of elements, (e.g., things that are cuddly or Broadway shows). The overlapping region between two circles contains elements that belong to both sets (e.g., “cats”). Much like in using scatter plots in statistics or drawing shapes in geometry, seeing one’s problem often clarifies it.
On supporting science journalism
If you’re enjoying this article, consider supporting our award-winning journalism by subscribing. By purchasing a subscription you are helping to ensure the future of impactful stories about the discoveries and ideas shaping our world today.
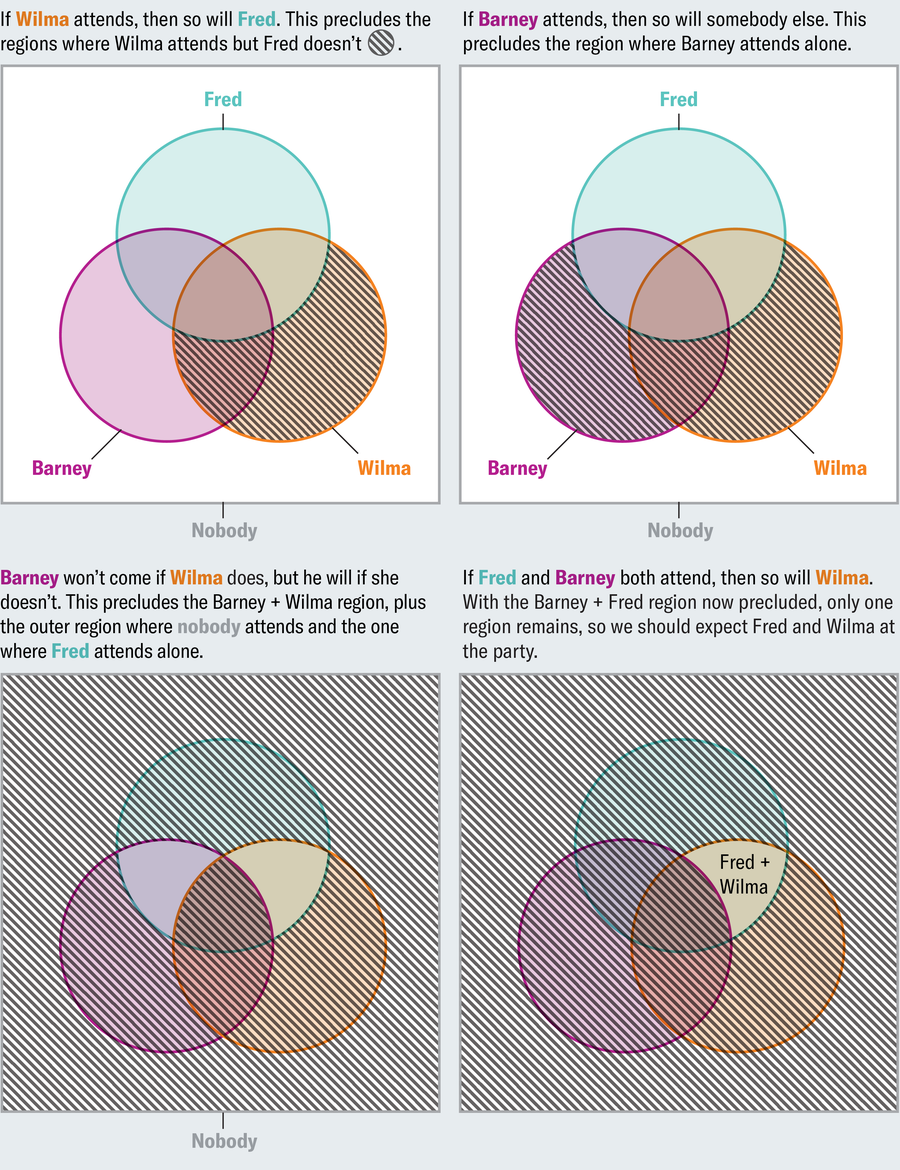
Imagine you’re planning a dinner party and navigating your friends’ fickle preferences. If Wilma attends, then so will Fred. If Barney attends, then so will somebody else. Barney won’t come if Wilma comes, but he will if she doesn’t. If Fred and Barney both attend, then so will Wilma. Who should you expect to show up? This poser is hard to work through when we are only given the text. A Venn diagram provides a systematic way to visualize and solve it. Each statement precludes some possible outcomes, which we indicate by shading the corresponding regions of the Venn diagram.
Most Venn diagrams you encounter depict either two or three overlapping circles, but what if you have four or more sets to consider?
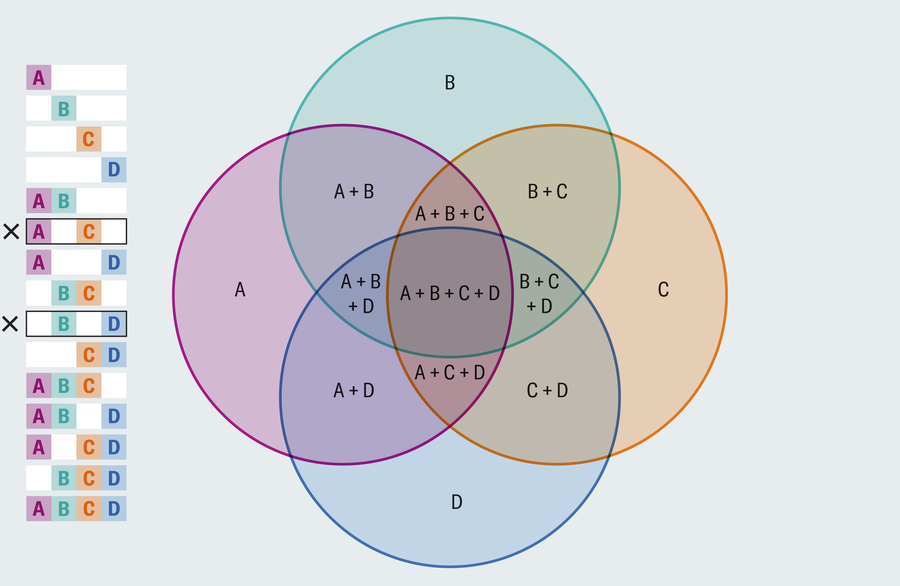
Did you spot the problem? There is no region where only A and C overlap that doesn’t also include another region, and likewise for B and D. A proper Venn diagram depicts every combination of intersections. Rejiggering the layout won’t help. Every four-circle drawing suffers the same flaw.
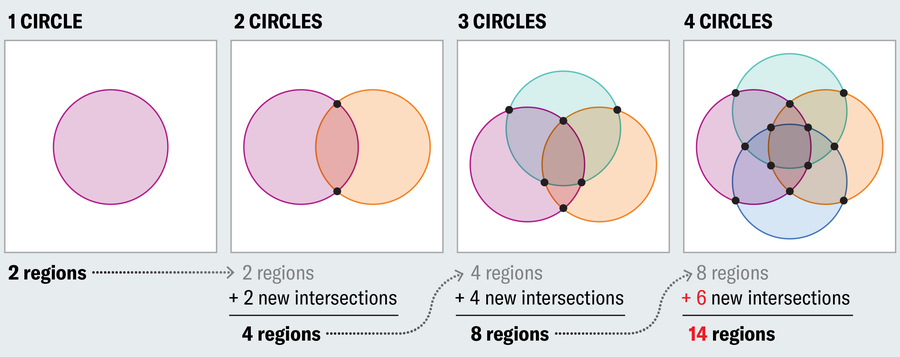
To see why, start with a single circle and note that it establishes two regions—interior and exterior. When we add a second set of elements (a new circle), we double the possibilities, so we need to double the number of regions (first set, second set, both sets and neither set). The only way to do this is to have the second circle intersect the first at two points (touching at only one point would result in only three regions: first set, second set or neither). This trend continues, where each new circle must double the number of regions if we want to represent all logical possibilities. But the number of new regions cannot exceed the number of new intersections, and a new circle can intersect the existing circles at only two points each. This works fine when adding a third circle because we need to add four regions, and the new circle can intersect the two existing circles at two points each for four total new intersection points. But it breaks down with a fourth circle, where we need eight new regions but can only muster six new points of intersection.
Of course, we don’t need to restrict ourselves to circles. We could easily trace a wiggly loop through a three-circle diagram so that it carves out the necessary number of regions, but we would lose the elegance in the diagram. Four intersecting spheres can also represent the right number of regions, but three-dimensional visuals are hard to parse. John Venn knew of the shortcoming with circles, so he proposed ellipses to represent four sets.
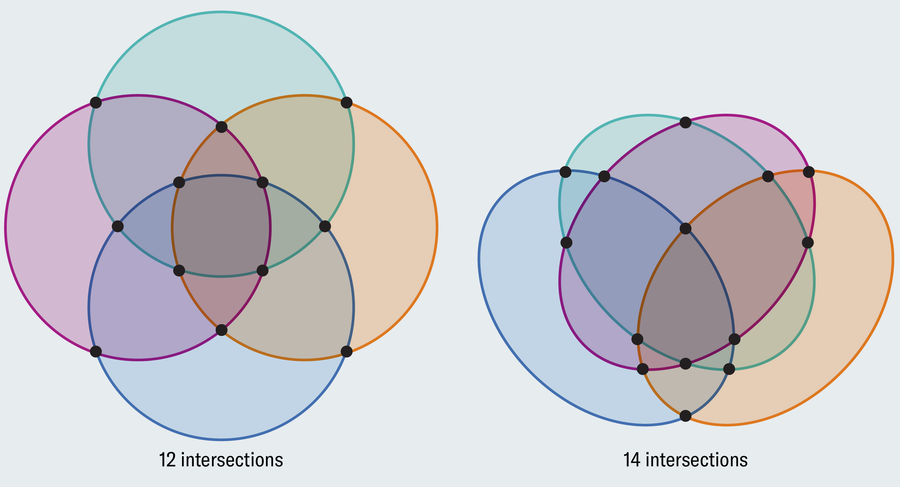
Amanda Montañez; Source: “Venn Diagrams and Independent Families of Sets,” by Branko Grünbaum in Mathematics Magazine, Vol. 48, No. 1; January 1975 (reference)
Unlike circles, two ellipses can intersect at four points. This overcomes the limitations with circles but only temporarily. Ellipses work for four and five sets before failing in the same way that circles did. As the number of sets grows, we need more and more exotic shapes to portray them.
One could reasonably argue that beyond four sets of elements, Venn diagrams lose their utility. The four-ellipse image is already pretty chaotic. Maybe for five-plus sets we should abandon visual representations. But utility does not animate the mathematician so much as beauty and curiosity. Although Venn diagrams initially applied to logic and set theory, the four-circle conundrum raised an interesting geometry question. That seed has blossomed into a fascinating investigation into the geometry of Venn diagrams that continues today.
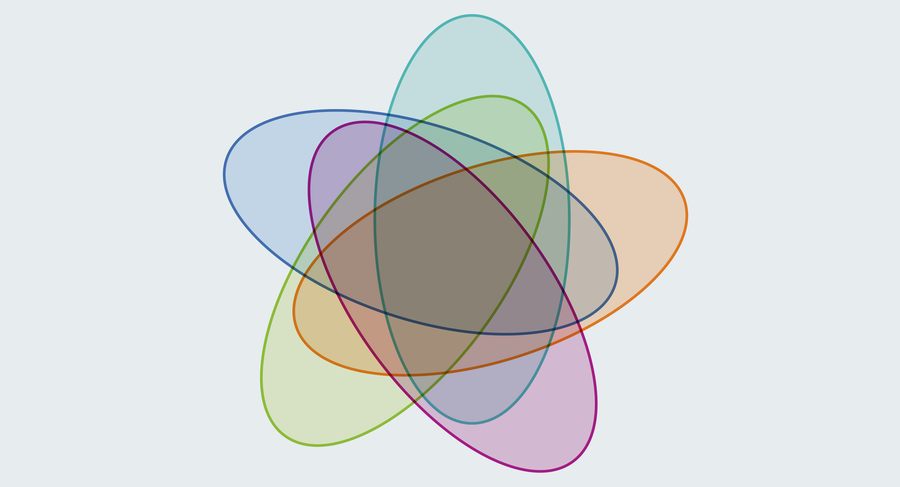
Venn and his successors believed that ellipses couldn’t portray all 32 regions required for a five-set diagram. Not until 1975 did mathematician Branko Grünbaum prove them wrong by example:
Amanda Montañez; Source: “Venn Diagrams and Independent Families of Sets,” by Branko Grünbaum in Mathematics Magazine, Vol. 48, No. 1; January 1975 (reference)
Notice also that Grünbaum’s diagram displays a pleasing rotational symmetry. Spinning it one fifth of a full rotation lands it back on itself, leaving the original shape unchanged. Typical two- and three-circle Venn diagrams share this property. Rotate a two-circle Venn diagram by 180 degrees (or a three-circle one by 120 degrees), and it looks the same. But the four-ellipse diagram doesn’t have rotational symmetry. Can that be fixed? What do two, three and five have in common that four doesn’t?
In 1960 a then undergraduate student at Swarthmore College, David W. Henderson, answered this question with a surprising discovery (Stan Wagon and Peter Webb filled in some gaps later): Rotationally symmetric Venn diagrams are possible only when the number of sets is a prime number—a number divisible only by 1 and itself, such as 2, 3 and 5 but not 4. Henderson only showed that a prime number of sets is necessary, not that you can always design a symmetric Venn diagram for every prime number. Thus began a contest to find larger and larger examples. Here’s a wild-looking 11-set Venn diagram from Peter Hamburger.
Mathematicians at the University of South Carolina settled the question in 2004 by showing that rotationally symmetric Venn diagrams exist for every prime number of sets. If you think this caused mathematicians to pack up their pencils and lay the study of Venn diagrams to rest, then you haven’t been following along. Instead the community has raised their aesthetic standards, seeking figures with even more refined properties.
Our opening quote contended that Venn diagrams are overrated. Even those who agree must admit that they have a curious allure. Take the sets of interesting topics in logic, in geometry and in visualization, and you’ll find Venn diagrams at the intersection.

