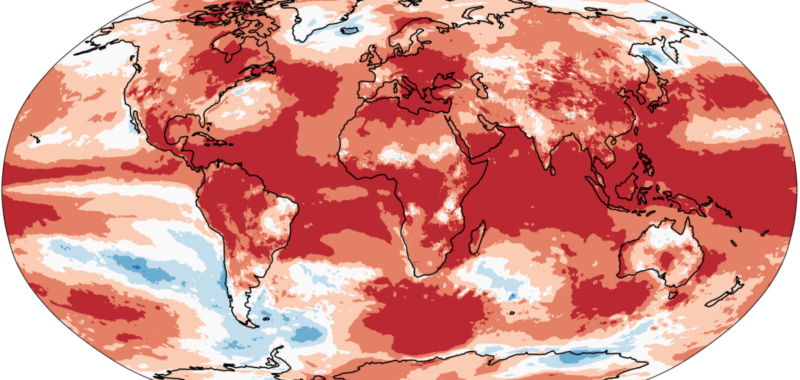
Lining up the baselines shows that these different services largely agree with each other, with most of the differences due to uncertainties in the measurements, with the rest accounted for by slightly different methods of handling things like areas with sparse data.
Describing the details of 2024, however, doesn’t really capture just how exceptional the warmth of the last two years has been. Starting in around 1970, there’s been a roughly linear increase in temperature driven by greenhouse gas emissions, despite many individual years that were warmer or cooler than the trend. The last two years have been extreme outliers from this trend. The last time there was a single comparable year to 2024 was back in the 1940s. The last time there were two consecutive years like this was in 1878.

Credit:
Copernicus
“These were during the ‘Great Drought’ of 1875 to 1878, when it is estimated that around 50 million people died in India, China, and parts of Africa and South America,” the EU’s Copernicus service notes. Despite many climate-driven disasters, the world at least avoided a similar experience in 2023-24.
Berkeley Earth provides a slightly different way of looking at it, comparing each year since 1970 with the amount of warming we’d expect from the cumulative greenhouse gas emissions.

Relative to the expected warming from greenhouse gasses, 2024 represents a large departure.
Credit:
Berkeley Earth
These show that, given year-to-year variations in the climate system, warming has closely tracked expectations over five decades. 2023 and 2024 mark a dramatic departure from that track, although it comes at the end of a decade where most years were above the trend line. Berkeley Earth estimates that there’s just a 1 in 100 chance of that occurring due to the climate’s internal variability.
Is this a new trend?
The big question is whether 2024 is an exception and we should expect things to fall back to the trend that’s dominated since the 1970s, or it marks a departure from the climate’s recent behavior. And that’s something we don’t have a great answer to.

